Data Visualization and Community Feedback Survey - August 12 and 13, 2025
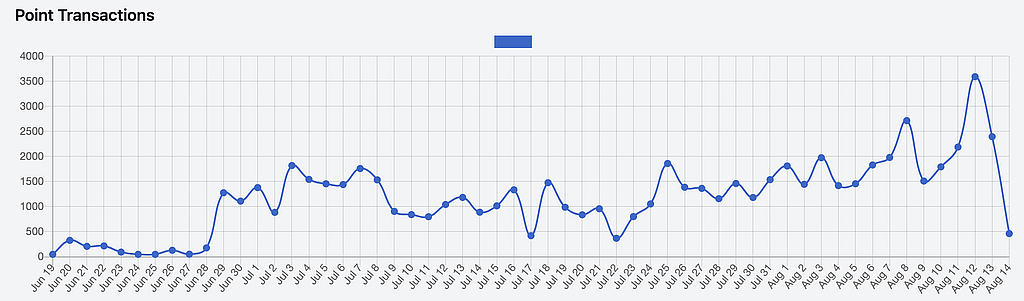
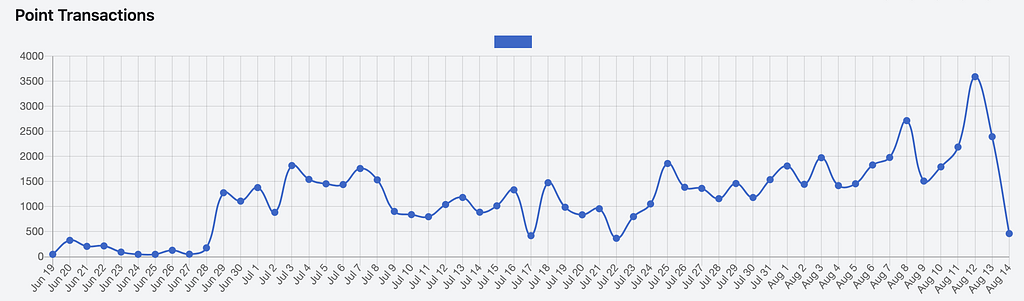
We have integrated the powerful open-source JavaScript library Chart.js to create dynamic, interactive charts (such as line charts, bar charts, pie charts, and area charts) for visualizing core data on pickful. This will help us better manage and present community insights.

Reply